The npm blog has been discontinued.
Updates from the npm team are now published on the GitHub Blog and the GitHub Changelog.
How we deploy at npm
Here’s how we deploy node services at npm:
cd ~/code/exciting-service
git push origin +master:deploy-production
That’s it: git push and we’ve deployed.
Of course, a lot is triggered by that simple action. This blog post is all about the things that happen after we type a git command and press Return.
Goals
As we worked on our system, we were motivated by a few guiding principles:
- deploying should be so easy there’s no reason not to;
- rolling back a push should be as easy as the original push was;
- our team is small: automate everything!
- everything a service needs to start must be on the host with it;
- each step is simple & useful on its own;
- everything can be run by hand (or by a Slack bot!) if necessary;
- every step can be run many times without harm.
Why? We want no barriers to pushing out code once it’s been tested and reviewed, and no barriers to rolling it back if something surprising happens — so any friction in the process should be present before code is merged into master, via a review process, not after we’ve decided it’s good. By separating the steps, we gain finer control over how things happen. Finally, making things repeatable means the system is more robust.
Thousand-foot view
What happens when you do that force-push to the deploy-production branch? It starts at the moment an instance on AWS is configured for its role in life.
We use Terraform and Ansible to manage our deployed infrastructure. At the moment I’m typing, we have around 120 AWS instances of various sizes, in four different AWS regions. We use Packer to pre-bake an AMI based on Ubuntu Trusty with most of npm’s operational requirements, and push it out to each AWS region.
For example, we pre-install a recent LTS release of node as well as our monitoring system onto the AMI. This pre-bake greatly shortens the time it takes to provision a new instance. Terraform reads a configuration file describing the desired instance, creates it, adds it to any security groups needed and so on, then runs an Ansible playbook to configure it.
Ansible sets up which services a host is expected to run. It writes a rules file for the incoming webhooks listener, then populates the deployment scripts. It sets up a webhook on GitHub for each of the services this instance needs to run. Ansible then concludes its work by running all of the deploy scripts for the new instance once, to get its services started. After that, it can be added to the production rotation by pointing our CDN at it, or by pointing other processes to it through a configuration change.
This setup phase happens less often than you might think. We treat microservices instances as disposable, but most of them are quite long-lived.
So our new instance, configured to run its little suite of microservices, is now happily running. Suppose you then do some new development work on one of those microservices. You make a pull request to the repo in the usual way, which gets reviewed by your colleagues and tested on Travis. You’re ready to run it for real!
You do that force-push to deploy-staging, and this is what happens: A reference gets repointed on the GitHub remote. GitHub notifies a web hooks service listening on running instances. This webhooks service compares the incoming hook payload against its configured rules, decides it has a match, & runs a deploy script.
Our deploy scripts are written in bash, and we’ve separated each step of a deploy into a separate script that can be invoked on its own. We don’t just invoke them through GitHub hooks! One of our Slack chatbots is set up to respond to commands to invoke these scripts on specific hosts. Here’s what they do:
- pull code with git & run npm install
- update configuration from our config db
- roll services one process at a time
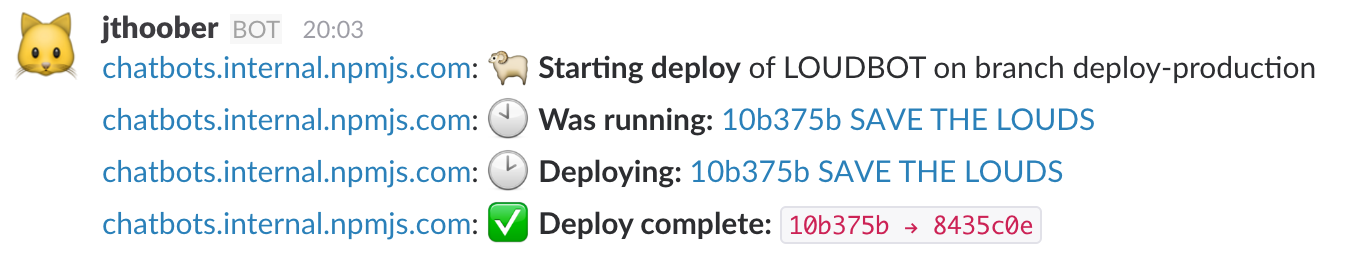
Each step reports success or failure to our company Slack so we know if a deploy went wrong, and if so at which step. We emit metrics on each step as well, so we can annotate our dashboards with deploy events.
Conventions
We name our deploy branches deploy-foo, so we have, for instance, deploy-staging, deploy-canary, and deploy-production branches for each repo, representing each of our deployment environments. Staging is an internal development environment with a snapshot of production data but very light load and no redundancy. Canary hosts are hosts in the production line that only take a small percentage of production load, enough to shake out load-related problems. And production is, as you expect, the hosts that take production traffic.
Every host runs a haproxy, which does load balancing as well as TLS termination. We use TLS for most internal communication among services, even within a datacenter. Unless there’s a good reason for a microservice to be a singleton, there are N copies of everything running on each host, where N is usually 4.
When we roll services, we take them out of haproxy briefly using its API, restart, then wait until they come back up again. Every service has two monitoring hooks at conventional endpoints: a low-cost ping and a higher-cost status check. The ping is tested for response before we put the service back into haproxy. A failure to come back up before a timeout stops the whole roll on that host.
You’ll notice that we don’t do any cross-host orchestration. If a deploy is plain bad and fails on every host, we’ll lose at most 1 process out of 4, so we’re still serving requests (though at diminished capacity). Our Slack operational incidents channel gets a warning message when this happens, so the person who did the deploy can act immediately. This level of orchestration has been good enough thus far when combined with monitoring and reporting in Slack.
You’ll also notice that we’re not doing any auto-scaling or managing clusters of containers using, e.g., Kubernetes or CoreOS. We haven’t had any problems that needed to be solved with that kind of complexity yet, and in fact my major pushes over the last year have been to simplify the system rather than add more moving parts. Right now, we are more likely to add copies of services for redundancy reasons than for scaling reasons.
Configuration
Configuration is a perennial pain. Our current config situation is best described as “less painful than it used to be.”
We store all service configuration in an etcd cluster. Engineers write to it with a command-line tool, then a second tool pulls from it and writes configuration at deploy time. This means config is frozen at the moment of deploy, in the upstart config. If a process crashes & restarts, it comes up with the same configuration as its peers. We do not have plans to read config on the fly. (Since node processes are so fast to restart, I prefer killing a process & restarting with known state to trying to manage all state in a long-lived process.)
Each service has a configuration template file that requests the config data it requires. This file is in TOML format for human readability. At deploy time the script runs & requests keys from etcd namespace by the config value, the service requesting the config, and the configuration group of the host. This lets us separate hosts by region or by cluster, so we can, for example, point a service at a Redis in the same AWS data center.
Here’s an example:
> furthermore get /slack_token/
slack_token matches:
/slack_token == xoxb-deadbeef
/slack_token.LOUDBOT == XOXB-0DDBA11
/slack_token.hermione == xoxb-5ca1ab1e
/slack_token.korzybski == xoxb-ca11ab1e
/slack_token.slouchbot == xoxb-cafed00d
Each of our chatbots has a different Slack API token stored in the config database, but in their config templates they need only say they require a variable named slack_token[1].
These config variables are converted into environment variable specifications or command-line options in an upstart file, controlled by the configuration template. All config is baked into the upstart file and an inspection of that file tells you everything you need to know.
Here’s LOUDBOT’s config template:
app = "LOUDBOT"
description = "YELL AND THEN YELL SOME MORE"
start = "node REAL_TIME_LOUDIE.js"
processes = 1

[environment]
  SERVICE_NAME = "LOUDBOT"
  SLACK_TOKEN = "{{slack_token}}"
And the generated upstart file:
# LOUDBOT node 0

description "YELL AND THEN YELL SOME MORE"

start on started network-services
stop on stopping network-services
respawn
setuid ubuntu
setgid ubuntu
limit nofile 1000000 1000000

script
    cd /mnt/deploys/LOUDBOT
    SERVICE_NAME="LOUDBOT" \
    SLACK_TOKEN="XOXB-0DDBA11" \
    node REAL_TIME_LOUDIE.js \
    >> logs/LOUDBOT0.log 2>&1
end script
This situation is vulnerable to the usual mess-ups: somebody forgets to override a config option for a cluster, or to add a new config value to the production etcd as well as to the staging etcd. That said, it’s at least easily inspectable, both in the db and via the results of a config run.
Open source
The system I describe above is sui generis, and it’s not clear that any of the components would be useful to anybody else. But our habit as an engineering organization is to open-source all our tools by default, so everything except the bash scripts is available if you’d find it useful. In particular, furthermore is handy if you work with etcd a lot.
- jthooks - add and remove webhooks from a Github repo
- jthoober - handle incoming Github webhooks to run shell scripts
- etcetera - read configuration from etcd & populate an upstart template
- furthermore - get & set etcd keys conveniently, with regexp searching
[1] The tokens in this post aren’t real. And, yes, LOUDBOT’s are always all-caps.